
The art of maps
Painters, cartographers and propagandists have all known the same secret: a map is not necessarily a neutral record. It is a picture of the world, and someone made a decision what to include, and what to omit.
In the back of Johannes Vermeer's The Art of Painting, completed around 1666–68, a huge wall map hangs behind the model. Vermeer renders its cracked, varnished surface with the same devotion he gives to the sitter's face. It shows the Seventeen Provinces of the Netherlands, flanked by views of twenty Dutch cities: a political unity that, by Vermeer's day, had long since split in two.
It is tempting to read that map as décor. However, it is better read as a statement.
Vermeer returned to maps again and again, and the Dutch households who hung them on their walls were buying more than navigation. They were buying a way of seeing their country, their trade and themselves. There is a quiet clue, too, in how these maps were made. Publishers often acquired old copper plates from earlier mapmakers and refreshed the decorative borders without always updating the geography beneath. A map could be handsome and out of date at the same time, and nobody in the room could tell.
That tension, between a map as a work of art and a map as a claim about the world, runs through everything that follows.
Looking down on a city before there were aeroplanes
In the autumn of 1502, Leonardo da Vinci was in Imola, in northern Italy, serving as military architect and engineer to Cesare Borgia, the ruthless commander who had seized the town three years earlier. Leonardo paced out the length of its streets, took bearings from the tower of the central Palazzo Comunale, and constructed his plan by geometry. The result is a city drawn as a perfect circle, ringed by the names of the winds in his own hand, in black chalk, ink and coloured wash. It is accurate enough that it is still said you could find your way around Imola with it today, and beautiful enough that it now hangs in the Royal Collection as a work of art. It was also, plainly, an instrument of power. A man who intends to hold a city needs to know exactly how it is laid out.
Two years earlier, Venice had been given a very different portrait. Jacopo de' Barbari's View of Venice, published in 1500 and printed from six woodblocks, measures roughly 1.3 by 2.8 metres: mural-sized and, at the time, unprecedented. It shows the city from a bird's-eye height that nobody had ever stood at, because there were no balloons, let alone aircraft. De' Barbari built it from measurement and imagination in equal parts. Mercury, god of commerce, presides over the city; Neptune rides a dolphin through the lagoon. Scholars have long read it as part survey and part advertisement, a map that is also an argument for Venice's wealth and importance.
 Both are artists using a map to interpret a built environment. One measures; the other celebrates. Neither pretends to be neutral.
Artists who bent the map on purpose
In 1943 the Uruguayan artist Joaquín Torres-García drew a small ink map of South America turned upside down, its southern tip pointing skywards. América Invertida was a manifesto in a few lines. His circle of artists, he argued, should recognise that "our north is the south" and stop taking their bearings from European models. Flipping the map was a way of refusing to sit at the bottom of the page.
Alighiero Boetti, the Italian conceptual artist, began a series in 1971 that he would continue until his death in 1994: world maps embroidered in Afghanistan, each country filled in with its national flag. Around 150 of these Mappe were made by Afghan embroiderers working from outlines Boetti supplied. He left the colour of the oceans to the women who stitched them, and the borders carry Italian phrases he devised alongside anecdotes in Farsi contributed by the embroiderers themselves. Because the flags changed as nations did, the series became a slow record of the world's political weather, the collapse of the Soviet Union included. Boetti famously said he had "invented nothing". He had simply let the world draw itself.
And in 1992 Simon Patterson made a lithograph called The Great Bear that looks, at first glance, like the London Underground map. Look closer and the stations have been replaced by names: philosophers, saints, comedians, explorers, footballers, grouped line by line. The title nods to Ursa Major; the Tube map, as Patterson saw it, was already a kind of star chart. It is a joke, and a sharp one, because it exposes how completely a diagram has come to stand in for the city it describes. A copy is in the Tate Museum collection.
The map is not the territory
In 1931 Harry Beck, a draughtsman working for the Underground, sketched a new kind of railway map. Rather than follow the geography above ground, he straightened the lines, allowed only 45- and 90-degree angles, and swelled the cluttered centre while compressing the suburbs. His employers' publicity department thought it too radical. By 1933 it was in the public's pockets, and it has barely stopped being copied since.
The cost is honesty about distance. Leicester Square and Covent Garden look like a proper journey on the diagram; on foot, they are a few hundred metres apart. It is the smallest of cartographic lies, and a benevolent one, and every map must tell some version of it, because a sphere cannot be flattened without distortion.
The most famous example is the Mercator projection of 1569, designed for navigators. It keeps compass bearings straight at the price of stretching land towards the poles. On a Mercator map, Greenland looks about as large as Africa. In reality, Africa is roughly fourteen times bigger. Centuries of classroom walls later, a campaign led by African advocacy groups, and now backed by the African Union, is pressing institutions to adopt projections that show the continent at its true size. The argument is no longer only about geometry. It is about whose importance a map quietly implies.
Maps that lie: for fun, for glory, for power
Starting with the harmless…
Mapmakers have long protected their work by hiding small fictions inside it. In the 1920s, Otto G. Lindberg of the General Drafting Company and his assistant Ernest Alpers invented a settlement called Agloe, an anagram of their initials, at a dirt-road junction in the Catskills of New York. If Agloe ever turned up on a rival's map, they would know it had been copied. It did turn up, on a Rand McNally map. But by then a general store had opened at the spot and taken its name from the map, so that when General Drafting cried foul, the fiction had become a real place. The map had created the town it described, and the case collapsed.
Then the more persuasive….
In 1877 the British illustrator Fred W. Rose published his Serio-Comic War Map for the Year 1877, with the Russian Empire drawn as a vast octopus, tentacles reaching out across Europe and Asia. Rose did not invent the image, but he made it famous, and it became a standard device of propaganda maps for generations. It also proved wonderfully portable. In 1904, as Russia and Japan went to war, a Japanese student named Kisaburō Ohara took Rose's map and redrew it for his own side, with Russia as the "Black Octopus". A caricature drawn to alarm Britain was recycled to rally Japan.
Then the accidental, which can be the most durable of all…
In 1798 James Rennell, among the most respected geographers of his day, drew a mountain range across West Africa. He based it on the account of the Scottish explorer Mungo Park, who had seen distant hills and been told they lay in a kingdom called Kong. Such was Rennell's reputation that the idea was instantly accepted, and the Mountains of Kong sat on maps of Africa for most of the nineteenth century, until the late 1880s. Even then they were slow to leave: they made a last appearance in a Vienna school atlas in 1905. A confident map can outlive the evidence against it by a very long time.
And finally, the deliberate...
From the 1930s onwards, nearly all published Soviet maps were falsified. In 1988, in the glasnost era, Moscow's top cartographer Viktor Yashchenko admitted as much: roads and rivers had been moved, city districts tilted, streets and houses wrongly marked. Accurate maps existed, but they were treated as state secrets. The public noticed. People, he said, did not recognise their own motherland on the maps. A corrected plan of Moscow, with all 3,100 of its avenues, squares, streets and lanes, was finally issued in 1989, and Soviet media credited the policy to Stalin.
The irony is that the deception mostly fooled Soviet citizens. Western reconnaissance satellites had mapped the Soviet heartland precisely for decades, and the Soviet military produced some of the most detailed plans of foreign cities ever drawn, down to street level in New York and Washington. After 1991 those maps began turning up in bookshops, including one in Latvia where a British geographer found a cache in 1993.
Maps that decide things
Sometimes a map does more than mislead. It makes the decision.
On 11 February 1812, the governor of Massachusetts, Elbridge Gerry, signed a redistricting law designed to keep his party in power. A little over a month later, on 26 March, the Boston Gazette printed a cartoon map of one of the contorted districts, with claws and wings added to make it a salamander. The engraver is generally identified as Elkanah Tisdale. The creature was dubbed the "Gerry-mander", and a word was born with an exact birthday, still in daily use more than two centuries later.

A more sombre example comes from the 1930s. Between 1935 and 1940, the US federal Home Owners' Loan Corporation sent surveyors into nearly 250 American cities and graded neighbourhoods from A to D, "best" to "hazardous", colouring them green, blue, yellow and red. The grades, which leaned heavily on who lived in each area, steered mortgage lending for decades. Red neighbourhoods were frequently those with Black or immigrant residents. The effect was not merely to record an inequality but to harden it. A 2018 study by the National Community Reinvestment Coalition found that nearly three-quarters of the neighbourhoods graded "hazardous" eight decades ago are low-to-moderate income today, and nearly two-thirds are minority neighbourhoods. The original maps survive, and anyone can explore them in the University of Richmond's Mapping Inequality project.
What a map leaves out
Line these examples up and a pattern appears. Leonardo decided a conqueror needed streets. De' Barbari decided Venice should look like the favourite of the gods. Beck decided passengers cared about connections, not metres. Soviet censors decided citizens should not know where they lived. The Home Owners' Loan Corporation decided which streets deserved credit. A map is a set of decisions about what matters, and the art of it, in every sense, is knowing what to leave out.
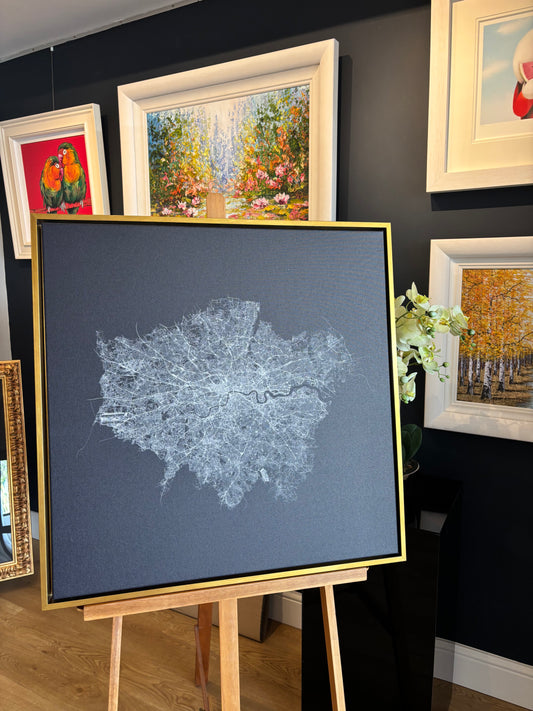
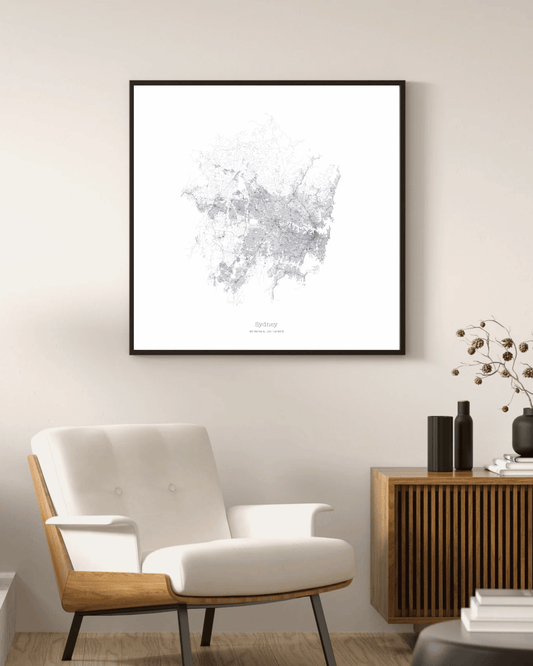
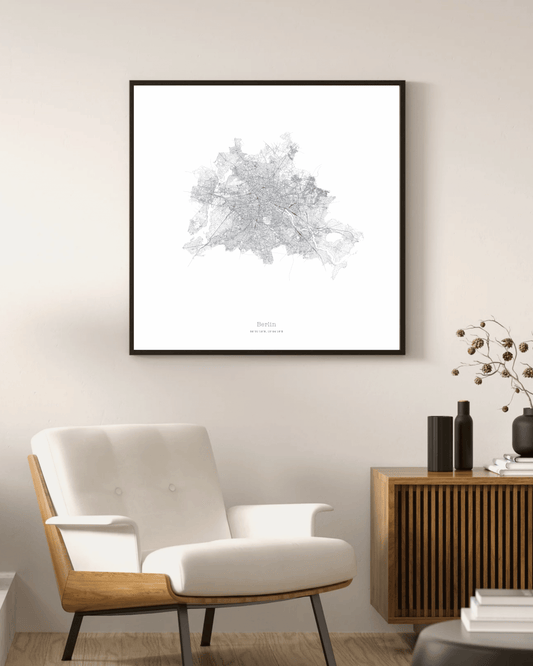
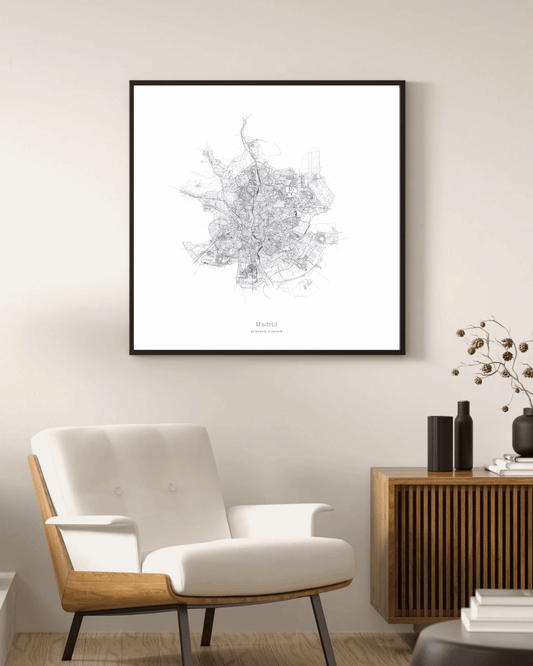
That is also the thinking behind Mapelio, which makes minimalist fine art maps of places for the wall rather than the glovebox. A Mapelio print leaves most of the world out, and does so openly: the framing, the level of detail and the palette are all choices, made so that one place can read as a piece of art. The personalised map maker hands that decision to the customer, who picks the place worth keeping, whether that is where they grew up, married or finally settled. It is the oldest use of a map there is. Less "here is the world", more "here is what matters to me".
So the next time you look at a map, whether on a wall, a phone or the side of a Tube carriage, ask who drew it, and what they left out. It is usually the most interesting part.

References and further reading
-
Vermeer maps: Google Arts & Culture, "Vermeer and his obsession with cartography"; Kunsthistorisches Museum Vienna
-
Leonardo, Imola: Royal Collection Trust (RCIN 912284); National Geographic, "Leonardo da Vinci transformed mapping from art to science"
-
De' Barbari: Minneapolis Institute of Art; Cleveland Museum of Art; Museum of Fine Arts, Boston
-
Torres-García: Smarthistory; Metropolitan Museum of Art, Modern Art Index Project
-
Boetti: MoMA collection; Sotheby's; Bidoun, "One Star Is Enough to Make a Cosmos"; Robilant+Voena
-
Patterson: London Transport Museum, "Adapting a design classic"; Arts Council Collection; Tate
-
Beck and the Tube map: London Transport Museum, "Transforming the Tube map"; Apollo magazine, "The tangled history of the London Tube map"
-
Mercator and Africa: The True Size Of; Reuters via Citizen Digital; Fox 6 / AP on the African Union-backed campaign
-
Agloe: Wikipedia; Exploring Upstate; New York Times (Sam Roberts, 29 March 2014)
-
Fred Rose: Cornell PJ Mode Collection; Leventhal Map & Education Center; Bodleian Map Room blog (2023)
-
Mountains of Kong: Wikipedia; Altea Gallery; Big Think, Strange Maps #733
-
Soviet maps: Deseret News, 19 September 1988 and 10 July 1989; Time magazine
-
Gerrymander: Library of Congress blogs (2017, 2024); American Bar Association Journal
-
Redlining: Mapping Inequality (University of Richmond et al.); National Community Reinvestment Coalition, "HOLC 'redlining' maps"
Featured image: Lionel Pincus and Princess Firyal Map Division. The New York Public Library.